Despite challenges, international students not only enrich campus diversity but also help the U.S. growth with economic, social, and cultural contributions. The following lines discuss the growth and recovery, major contributing countries, and potential shifts in Latin American student demographics, academic preferences, and economic impact.
International students are a vital part of the U.S. higher education system in economic, social and cultural terms. Although there are important debates on issues such as universities’ financial dependence on these students and related admissions policies, their legal status in the U.S. after their studies, and whether they will form part of a “brain drain” or return to contribute their skills to their home countries, there is also a broadly shared view that international students contribute to the diversity and dynamism of college campuses, create opportunities for cross-cultural dialogue, and at a broader level, help to strengthen ties between the U.S. and the students’ countries of origin.
Any discussion of their role and impact, however, must begin with an accurate picture of the countries of origin, growth and presence of these students in the U.S. today, particularly in the wake of the Covid19 pandemic, which naturally had a severe effect on the flow of international students.
According to the Institute for International Education (IIE)’s most recent Open Doors report, the overall number of international students in the U.S. has not yet recovered fully to pre-pandemic levels; nonetheless, it has grown substantially over the past two years since the pandemic slump. In the 2022/23 academic year, there were over 1 million international students in the U.S. (1,057,188), with an overall contribution to the U.S. economy of billions of dollars. The top countries of origin were China and India, contributing more than half of all international students in the U.S. (53%).
What is the place of Latin America in this panorama? IIE’s Open Doors report states that 81,945 students from all the countries and dependencies of South America, Central America and the Caribbean studied in the U.S. in 2022/23, representing 7.8% of the global total. The data we present in this report focuses on a more specific definition of Latin America, which includes only the 20 Spanish and Portuguese-speaking sovereign nations of the Americas and the Caribbean (thus excluding foreign dependencies and the English or French-speaking Caribbean).
All the graphs presented here result from our own analysis of data from the 2023 Open Doors report.
• According to the narrower definition of Latin America discussed above, the total number of students from Latin American countries was 71,444, representing 6.8% of the global total of international students in the U.S. in the 2022/23 academic year.
• Brazil, Mexico and Colombia have by far the largest numbers of students in the U.S., followed by Peru and Venezuela, with more than 4,000 students each. Half of these 20 Latin American countries have between 1,000 and 3,100 students in the U.S. Most (17) of these countries are ranked among the top 100 countries of origin of international students in the U.S.
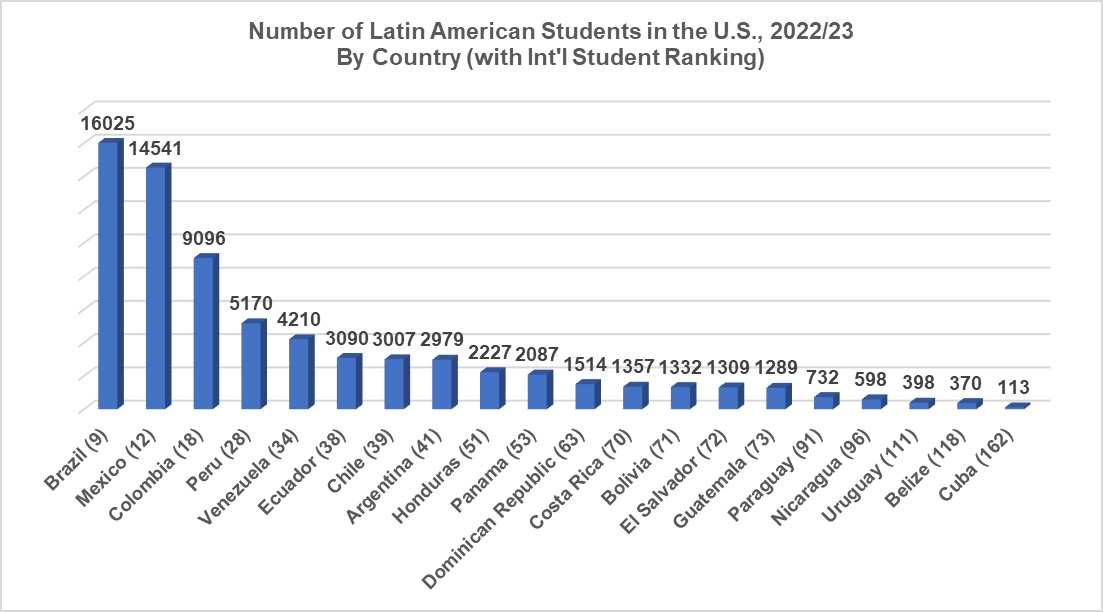
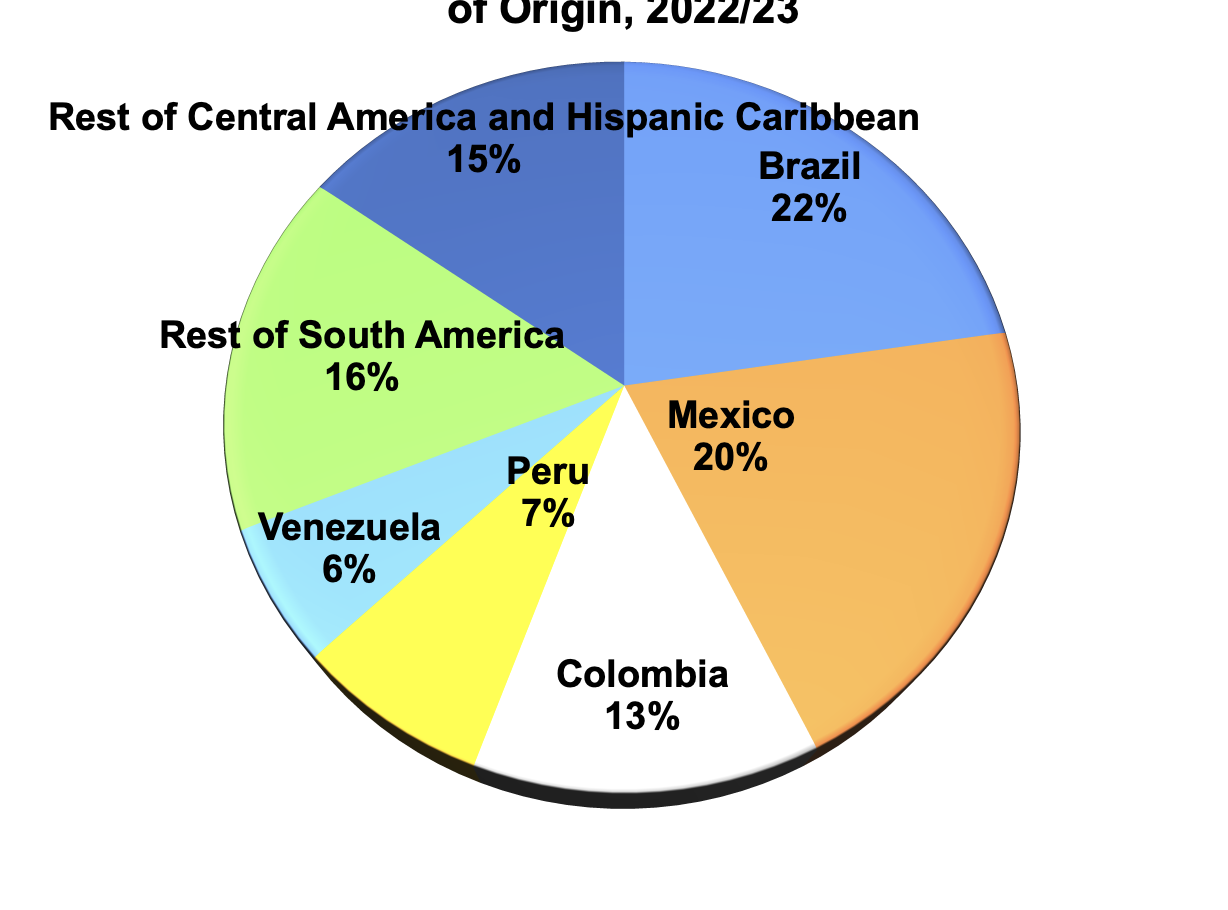
• Students from Brazil, Mexico and Colombia make up more than half (53%) of all students from Latin America in the U.S.; the top five countries contribute more than two-thirds (69%) of these.
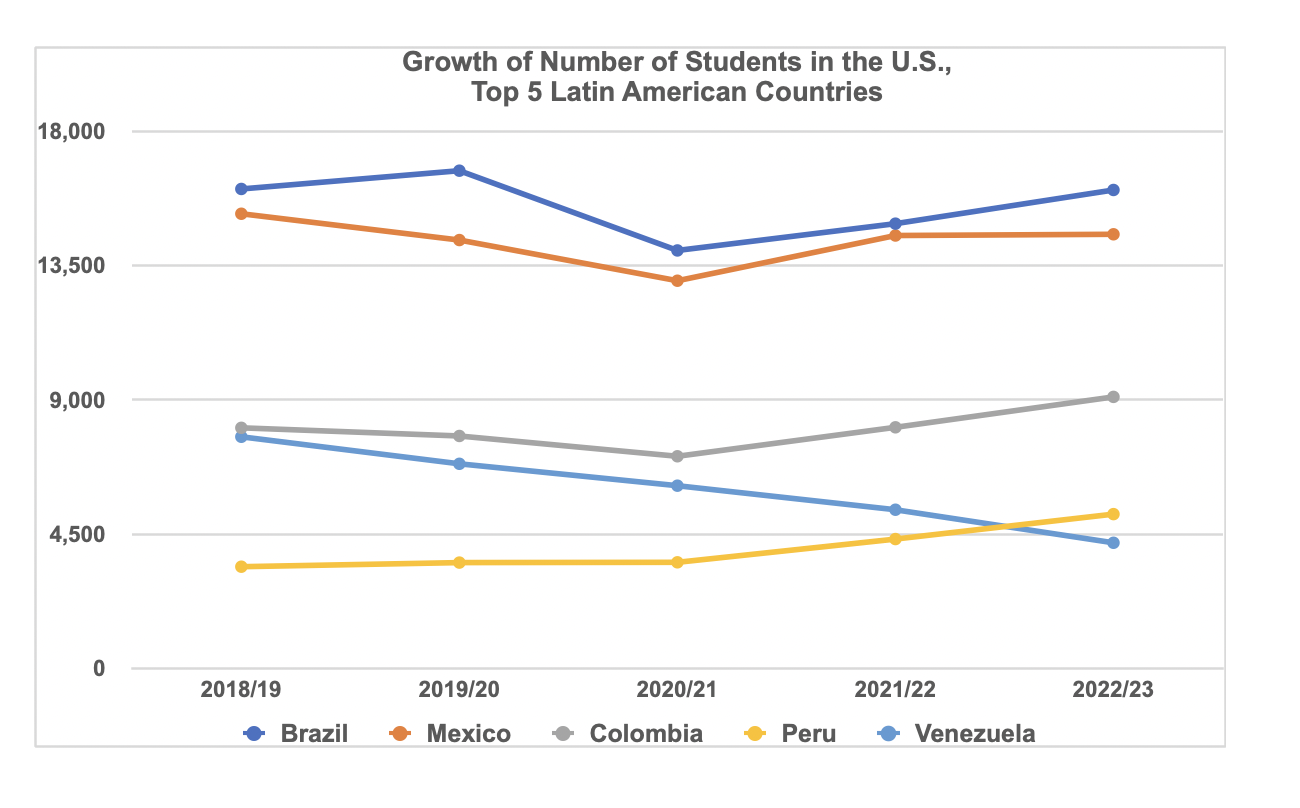
• Brazil, Mexico and Colombia have been among the top 20 countries of origin of international students for the past decade. After the pandemic slump of 2020/21, Brazil has experienced substantial growth over the past two years and is almost reaching the same number of students that were present in the U.S. in pre-pandemic years (16,059 in 2018/19 and 16,025 in 2022/23). Mexico has also been recovering, albeit at a slower pace; it has surpassed the number of students it had in the U.S. in 2019/20, but has yet to reach the same number recorded in 2018/19 (15,229 then, and 14,541 now).
• Among these top three countries, Colombia is showing the most positive post-pandemic recovery and growth trend, with an even greater number of students now than before the pandemic (8,060 in 2018/19 compared with 9,096 in 2022/23).
• Among the top five Latin American countries of origin of students in the U.S., Peru is currently experiencing the highest growth, with a 19.3 percent change in number of students between 2021/22 and 2022/23. Notably, Peru did not experience any decrease during the pandemic, and the number of Peruvian students in the U.S. has been rising steadily and continuously over the past five years.
• The number of Venezuelan students in the U.S., which in 2018/19 was higher than the number of Peruvian students and nearly as high as the number of Colombian students, has declined steadily over the past five years to nearly half of what it was. The decrease in Venezuelan students over the past two years is the most drastic among all Latin American countries; this trend seems to indicate that Venezuela will no longer be among the top five countries of origin over the next few years.
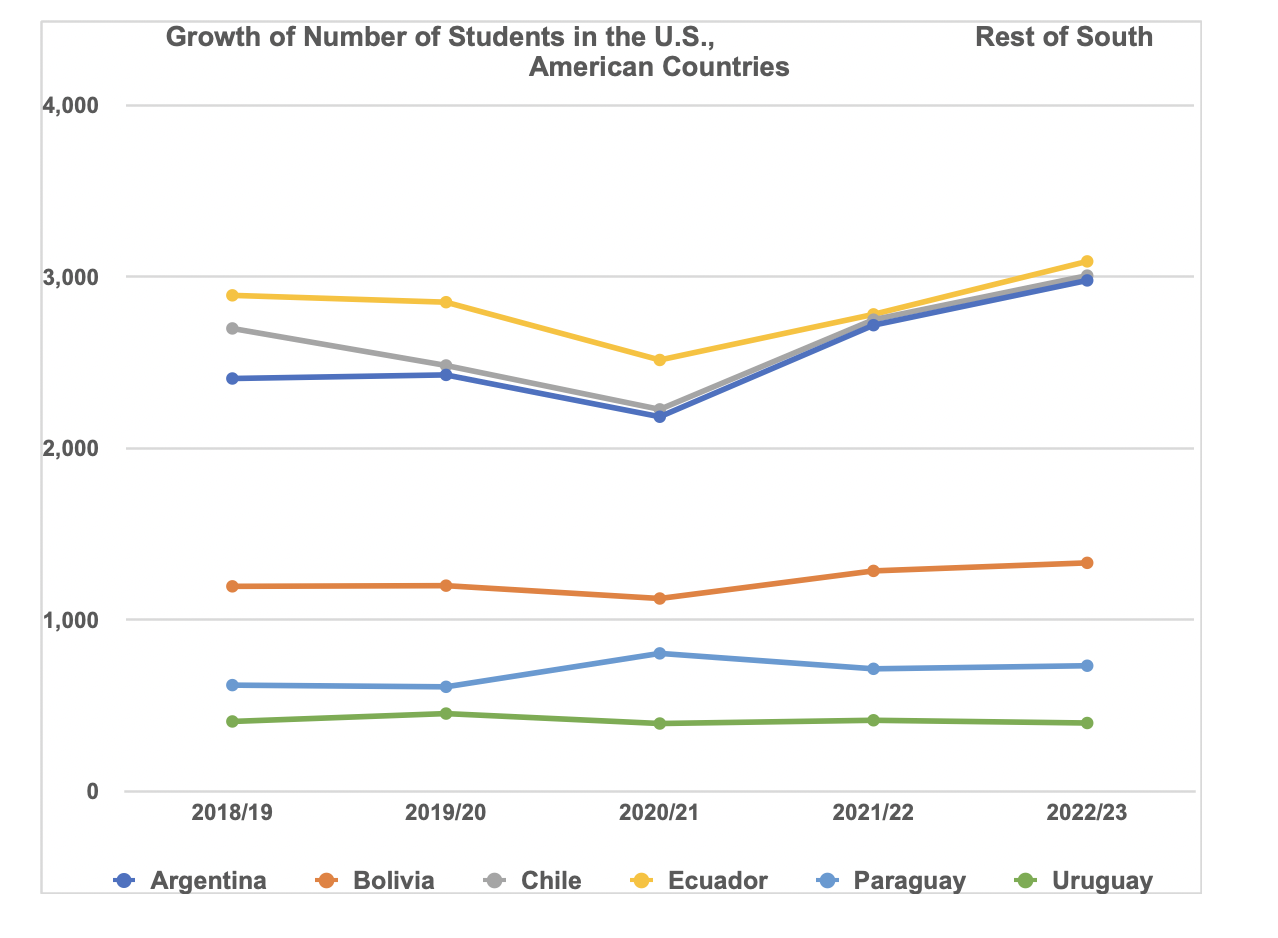
• Among the rest of the South American countries, Ecuador, Chile and Argentina seem poised to vie for the 5th place among Latin American countries, given that the current numbers of students in the U.S. from all three of these have surpassed pre-pandemic levels, and all three are experiencing rapid growth (particularly Ecuador).
• On the other hand, Uruguay has yet to reach its pre-pandemic level of students in the U.S., and has experienced negative growth over the past academic cycle. Paraguay has an intriguing growth pattern, since the number of Paraguayan students in the U.S. increased during the main pandemic year (2020/21) but has decreased since then. Further analysis is needed to explore this trend in greater depth.
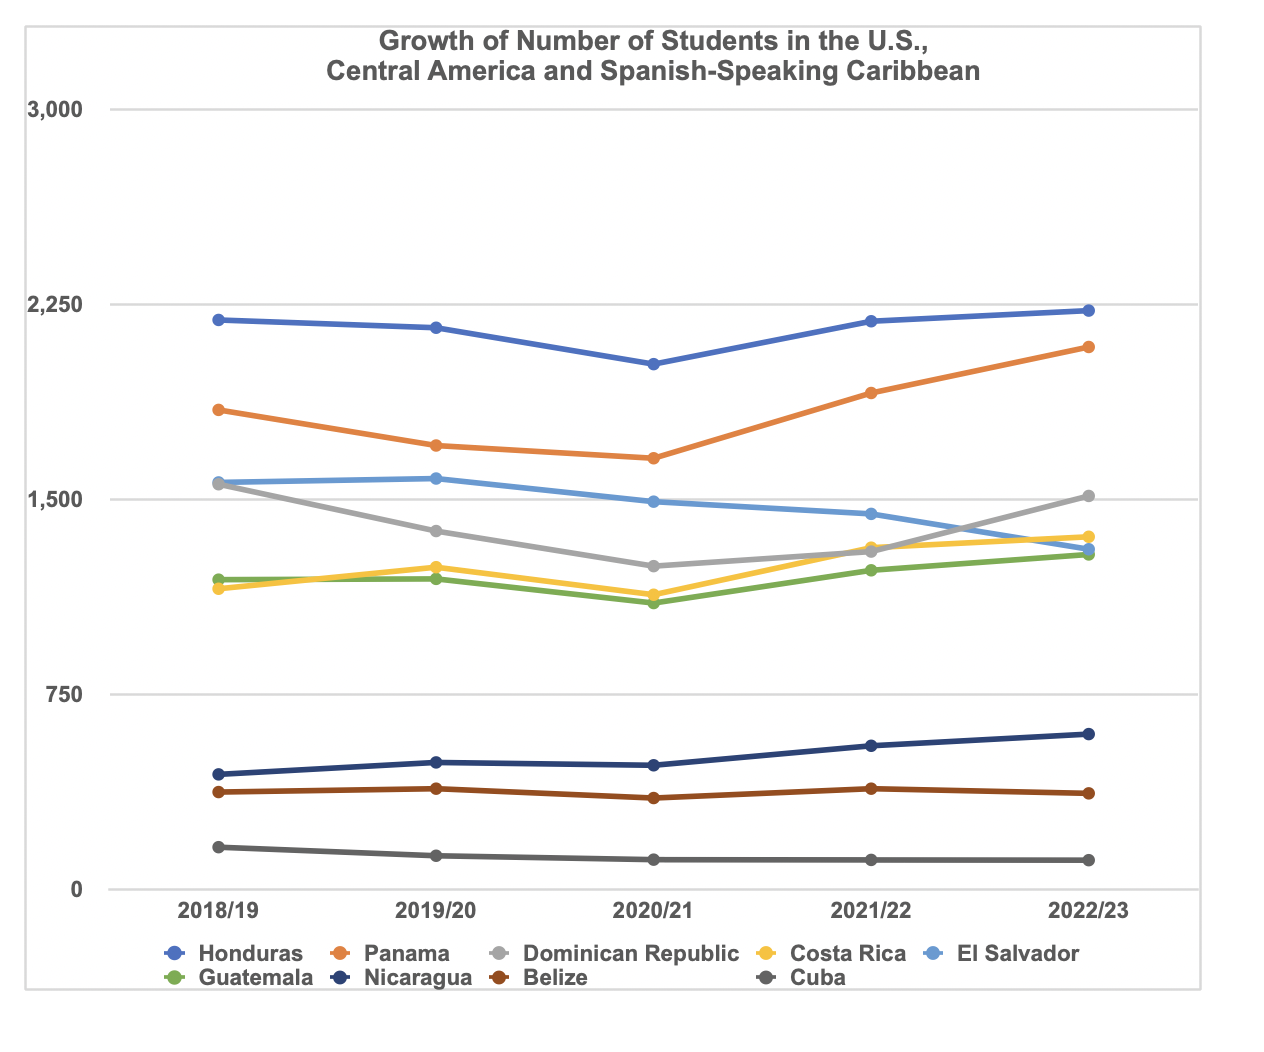
• Central American countries and those of the Spanish-speaking Caribbean, Honduras, Panama, Costa Rica, Guatemala and Nicaragua have all recovered from the pandemic slump and exceeded their pre-pandemic numbers of students in the U.S. The number of students from the Dominican Republic in the U.S. has also steadily increased but is yet to recover to pre-pandemic levels. Belize has had uneven growth in its numbers, while the presence of El Salvadorean and Cuban students in the U.S. has been reducing steadily over the past five years.
• The top receiving states for international students overall are California, New York and Texas, with over 50,000 students each. In the case of Latin America, Florida is the top state of residence, ranked in 1st or 2nd place for students from 17 of the 20 countries of the region, and in 4th place for another two; only Mexican students do not count Florida among their top five destinations. It is followed by Texas, which is among the top five destination states of 14 Latin American countries (in 1st or 2nd place for 9 of these countries), and New York, also among the top five destinations of 14 countries (in 2nd place for 7 of these countries).
• Other important states of residence for Latin American students are Massachusetts, a 3rd, 4th, or 5th place destination for students from 15 countries, and California, a top five destination for students from 12 countries (in 1st or 2nd place for 3 of these).
• Students from most Latin American countries enroll at public U.S. educational institutions at higher rates than private ones. Indeed, only students from Argentina and the Dominican Republic enrolled at higher rates at private institutions, with a little over half of students at these. Chilean and Guatemalan students enrolled at both public and private institutions nearly equally.
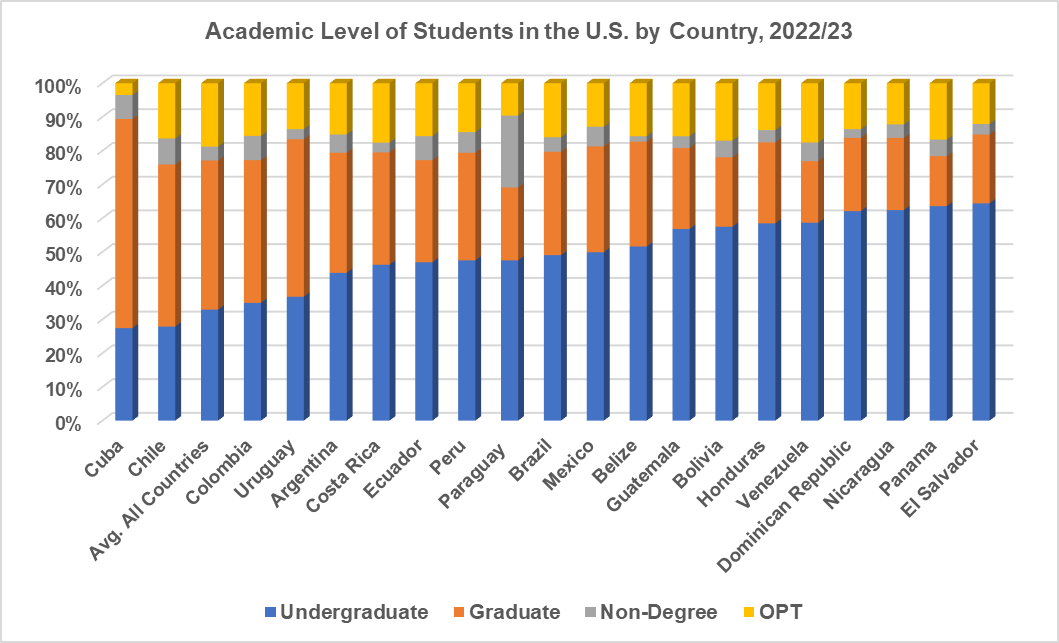
• On average, most international students in the U.S. study at the graduate level (44.2%), followed by the undergraduate level (32.9%), those engaged in Optional Practical Training - OPT (18.8%), and lastly, non-degree students (4.1%). This trend is different for students from most Latin American countries (16 out of 20), where the highest proportion of them (more than 43%) are enrolled at the undergraduate level in the U.S. Only Cuba, Chile, Colombia and Uruguay have a higher proportion of graduate students in the U.S.
• Students from 12 Latin American countries are also enrolled in non-degree programs at higher-than-average rates, with the highest rates among students from Paraguay (21.3%) and Chile (7.7%). At the same time, students from all these countries are engaged in OPT at much lower than the average rate (18.8%), with the highest rate among students from Costa Rica and Venezuela (17.6% for each), and the lowest among students from Cuba (3.5%).
• Regarding fields of study, most international students in the U.S. choose STEM subjects, with an average of 19.2% of all students enrolled in engineering and 23% in Math and Computer Sciences. Data available for Brazil, Mexico and Colombia indicates that these students enroll in these fields at much lower-than-average rates (13.5%, 16.1% and 16.9% respectively for each of these countries in Engineering, and only 7.5%, 7.1% and 6.6% respectively for Math and Computer Sciences). However, they have slightly higher-than-average rates of enrollment in Physical and Life Sciences (10.2%, 11.4%, and 10.4%, respectively, compared to the global average of 8%).
• At the same time, Brazil, Mexico and Colombia all have higher-than-average enrollment in Business and Management, with the highest proportion of students in all three countries (21.1%, 19.5% and 17.7%, respectively, compared to a global average of 14.9%). Students from these countries also enroll in Fine/Applied Arts, Humanities, and Social Sciences fields in higher proportions than the global average.
• The 2023 Open Doors student mobility fact sheets cite data from the U.S. Department of Commerce for 2022 regarding each country’s “international student economic impact” on the U.S. After adding the amounts for 14 of the 20 Latin American countries (data is not available for Ecuador, Bolivia, Paraguay, Uruguay, Belize and Cuba) the total contribution of these countries’ students to the U.S. economy was 2.57 billion dollars in 2022. Students from the largest sending countries naturally contributed the most, with Brazil and Mexico together contributing more than 1.2 billion dollars, nearly half the total amount for all 14 Latin American countries. •
Sources of data:
IIE, Open Doors 2023, various data spreadsheets at https://opendoorsdata.org/data/international-students/
IIE, Open Doors Student Mobility Fact Sheets by Country, at https://opendoorsdata.org/fact_sheets/student-mobility/
IIE, Open Doors Latin America and Caribbean Fact Sheet, at file:///C:/Users/DELL/Downloads/Open-Doors_FactSheets_Latin-America_Caribbean_2023.pdf
Place your job ad in our classified page on the HO print & digital Edition